Long story short…
- Most email marketing campaign reports are full of vanity numbers that look impressive but don’t tell you whether your campaign is actually making money.
- Open rate, click-through rate, click-to-open rate, conversion rate, revenue per email, bounce rate, unsubscribe rate, list growth rate, and spam complaint rate are the metrics that genuinely move the needle for any email marketing campaign.
- This guide breaks down what each metric means, how to calculate it, and what healthy benchmarks look like.
- Tools like EmailFunnel AI can help you track and improve these numbers automatically instead of pulling reports by hand.
- Bottom line: skip the vanity metrics and focus on the ones tied to real business outcomes.
Introduction
If you’ve ever pulled up a report after sending an email blast and stared blankly at a wall of numbers, you’re not alone. Every email marketing campaign generates a flood of data - opens, clicks, bounces, unsubscribes, conversions - and it’s easy to get lost chasing metrics that feel good but don’t actually tell you anything useful.
The truth is, not all metrics are created equal. Some numbers make you feel productive without moving your business forward. Others are quiet indicators of whether your email marketing campaign is genuinely working - bringing in revenue, building a loyal audience, and justifying the time you put into it.
In this guide, we’ll walk through the metrics that actually matter for any email marketing campaign, why they matter, how to calculate them, and what benchmarks to aim for. By the end, you’ll know exactly which numbers to watch and which ones you can safely ignore.
Why Metrics Matter for Every Email Marketing Campaign
Before diving into specific numbers, it’s worth asking: why measure at all?
A well-tracked email marketing campaign gives you a feedback loop. Without metrics, you’re sending emails into the void, hoping something sticks. With the right metrics, you can:
- Identify what content, subject lines, and offers resonate with your audience
- Catch deliverability issues before they tank your sender reputation
- Justify email marketing spend to stakeholders with real ROI numbers
- Continuously improve each subsequent email marketing campaign based on data, not guesswork
The key is knowing which metrics reflect real performance and which are just noise.
1. Open Rate
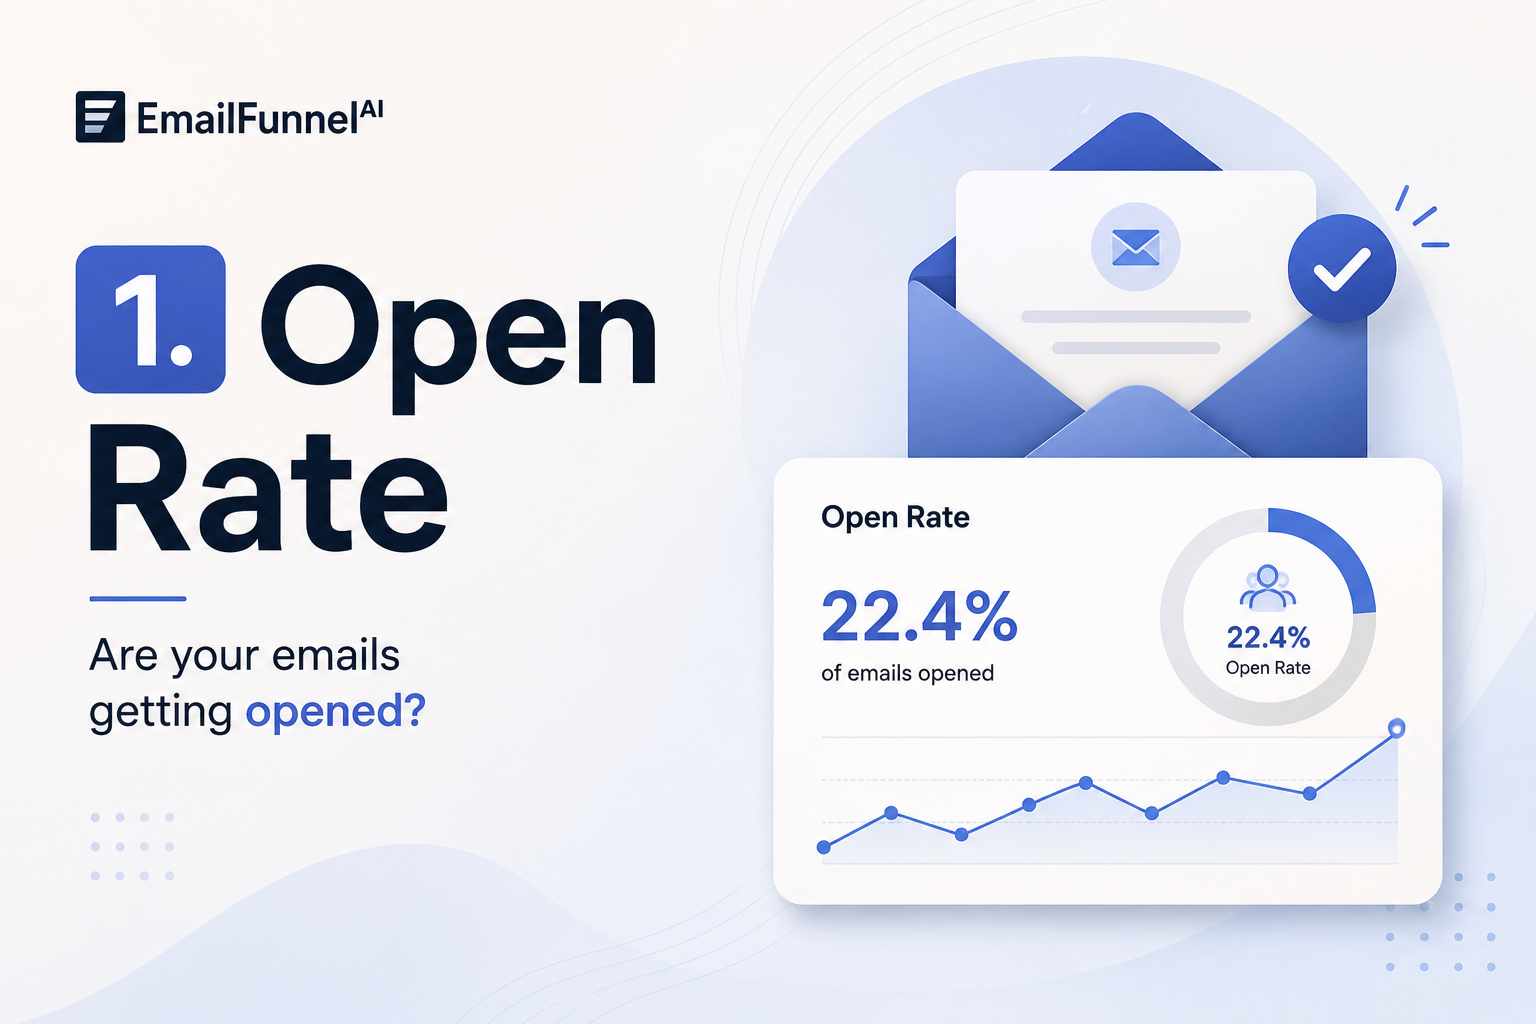
Open rate is often the first metric marketers check, and for good reason - it tells you whether your subject line and sender name are compelling enough to get someone to click into the email.
Formula: (Unique Opens ÷ Emails Delivered) × 100
Why it matters: A low open rate on an email marketing campaign usually signals one of three problems: a weak subject line, poor list segmentation, or deliverability issues (your emails are landing in spam).
Benchmark: Most industries see average open rates between 15–25%, though this varies significantly by sector and list quality.
Caveat: Since Apple’s Mail Privacy Protection changes, open rate data has become less reliable because it can be artificially inflated by automatic image loading. Use it as a directional indicator, not gospel.
2. Click-Through Rate (CTR)
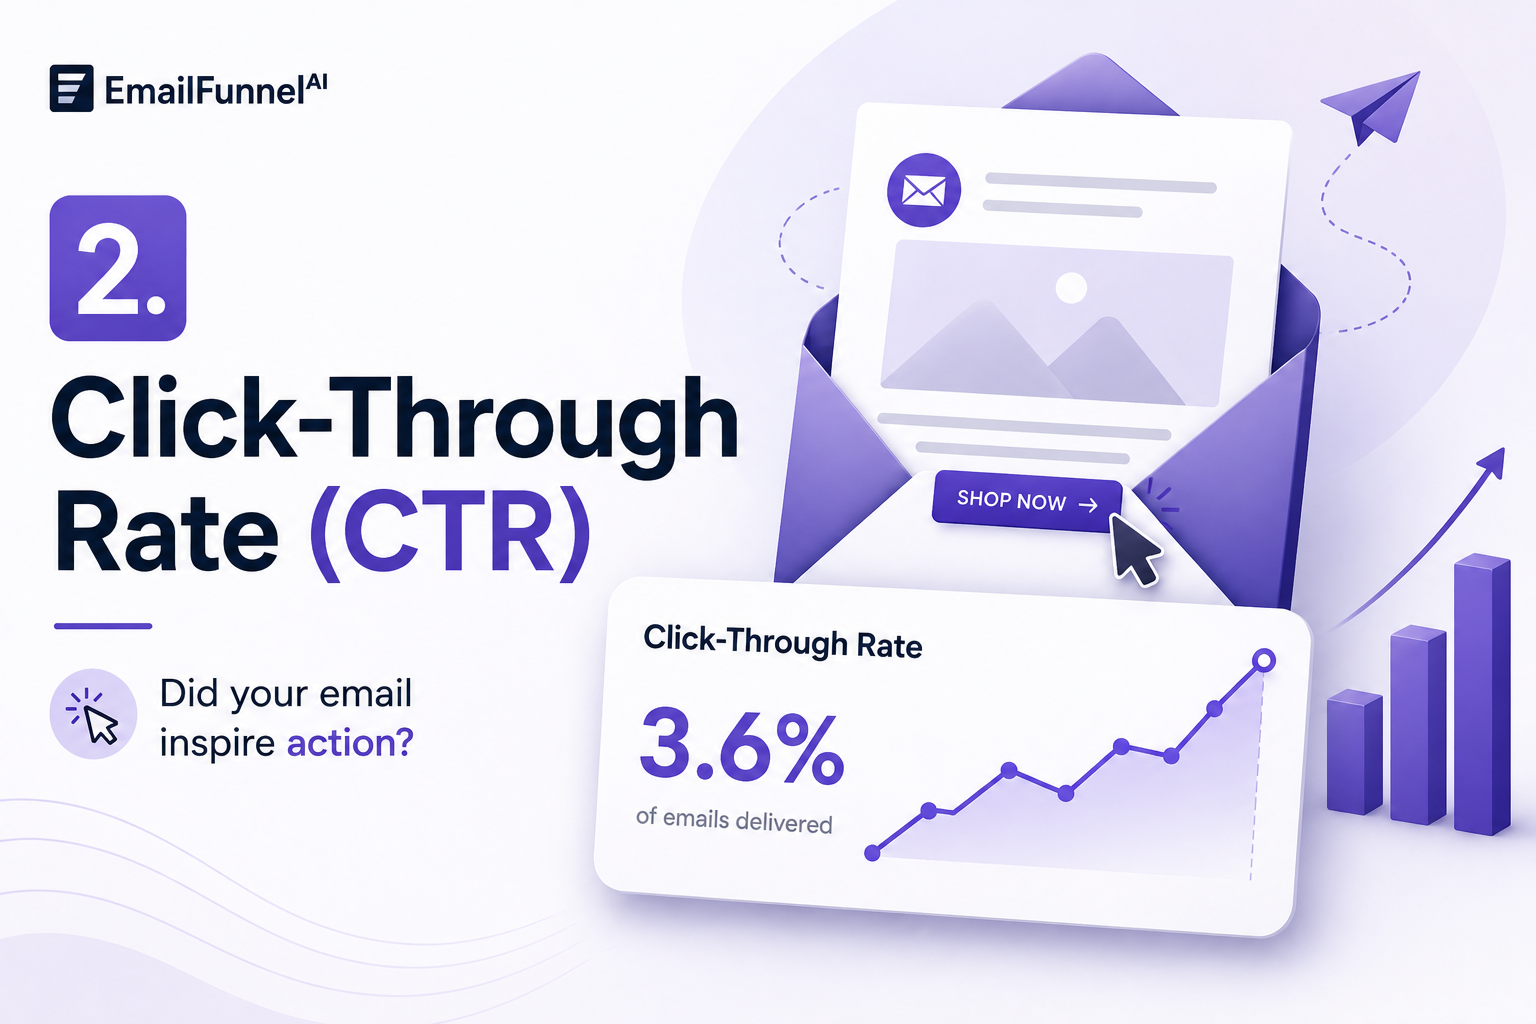
While open rate tells you whether people saw your email, click-through rate tells you whether they cared enough to act on it. This is one of the most important engagement metrics for any email marketing campaign because it reflects actual interest in your content or offer.
Formula: (Total Clicks ÷ Emails Delivered) × 100
Why it matters: CTR is a much stronger signal of email marketing campaign quality than open rate. It shows your content and call-to-action are compelling enough to drive real engagement.
Benchmark: A healthy CTR typically falls between 2–5%, though this varies widely by industry and audience warmth.
3. Click-to-Open Rate (CTOR)
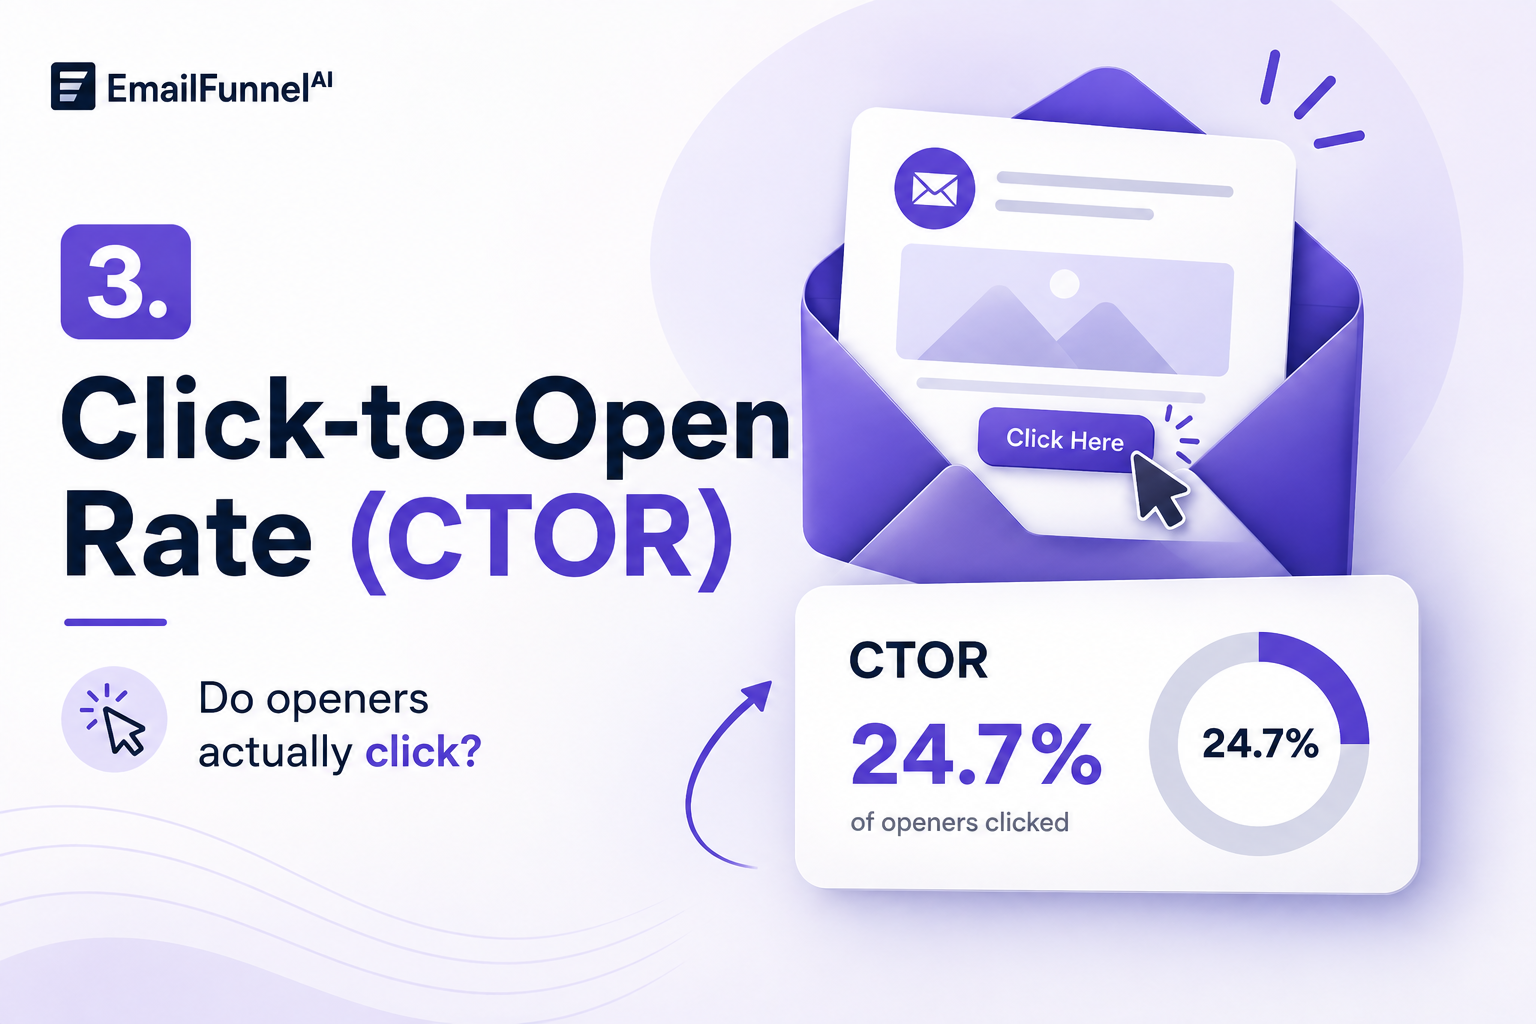
CTOR narrows things down further by only looking at the people who opened the email and then measuring how many of them clicked. This isolates content performance from subject line performance.
Formula: (Total Clicks ÷ Unique Opens) × 100
Why it matters: If your open rate is strong but your CTOR is weak, the problem isn’t your subject line - it’s your email content, design, or offer. This distinction helps you diagnose exactly where an email marketing campaign is underperforming.
4. Conversion Rate
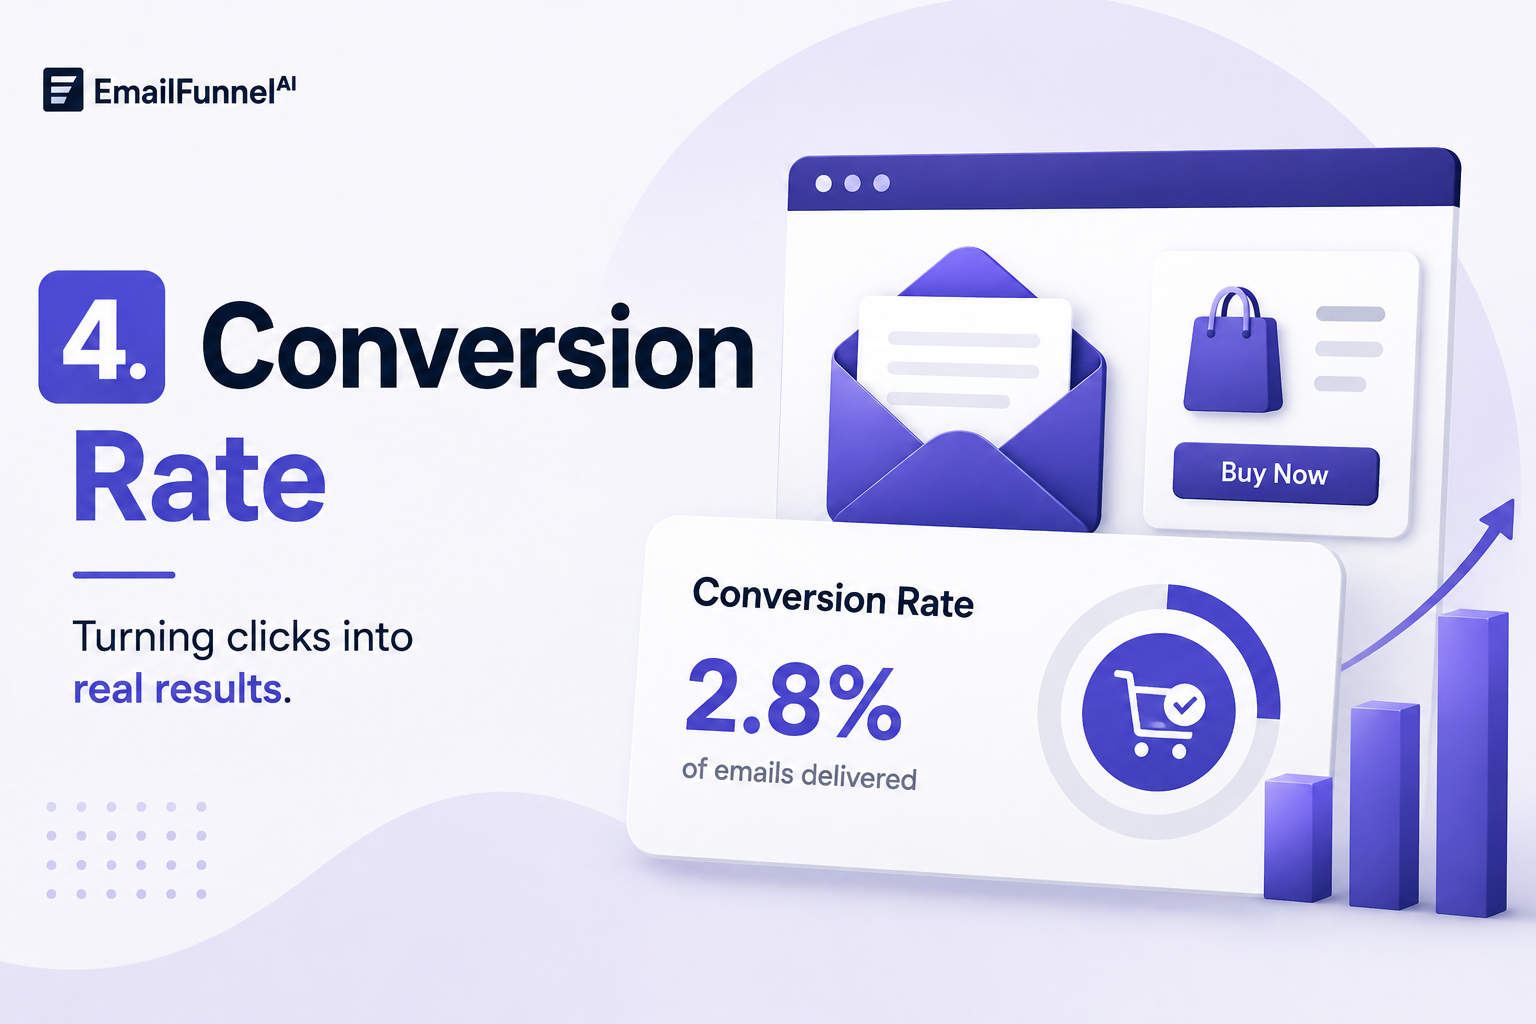
This is arguably the most important metric of all, because it connects your email marketing campaign directly to business outcomes - purchases, sign-ups, downloads, bookings, or whatever action defines success for your goal.
Formula: (Conversions ÷ Emails Delivered) × 100
Why it matters: Opens and clicks are proxy metrics. Conversions are the real thing. A campaign with a mediocre open rate but a high conversion rate is doing its job far better than one with flashy engagement numbers and no sales to show for it.
Benchmark: Conversion rates vary enormously by industry and offer type, typically ranging from 1–5% for ecommerce emails.
5. Revenue Per Email (RPE)
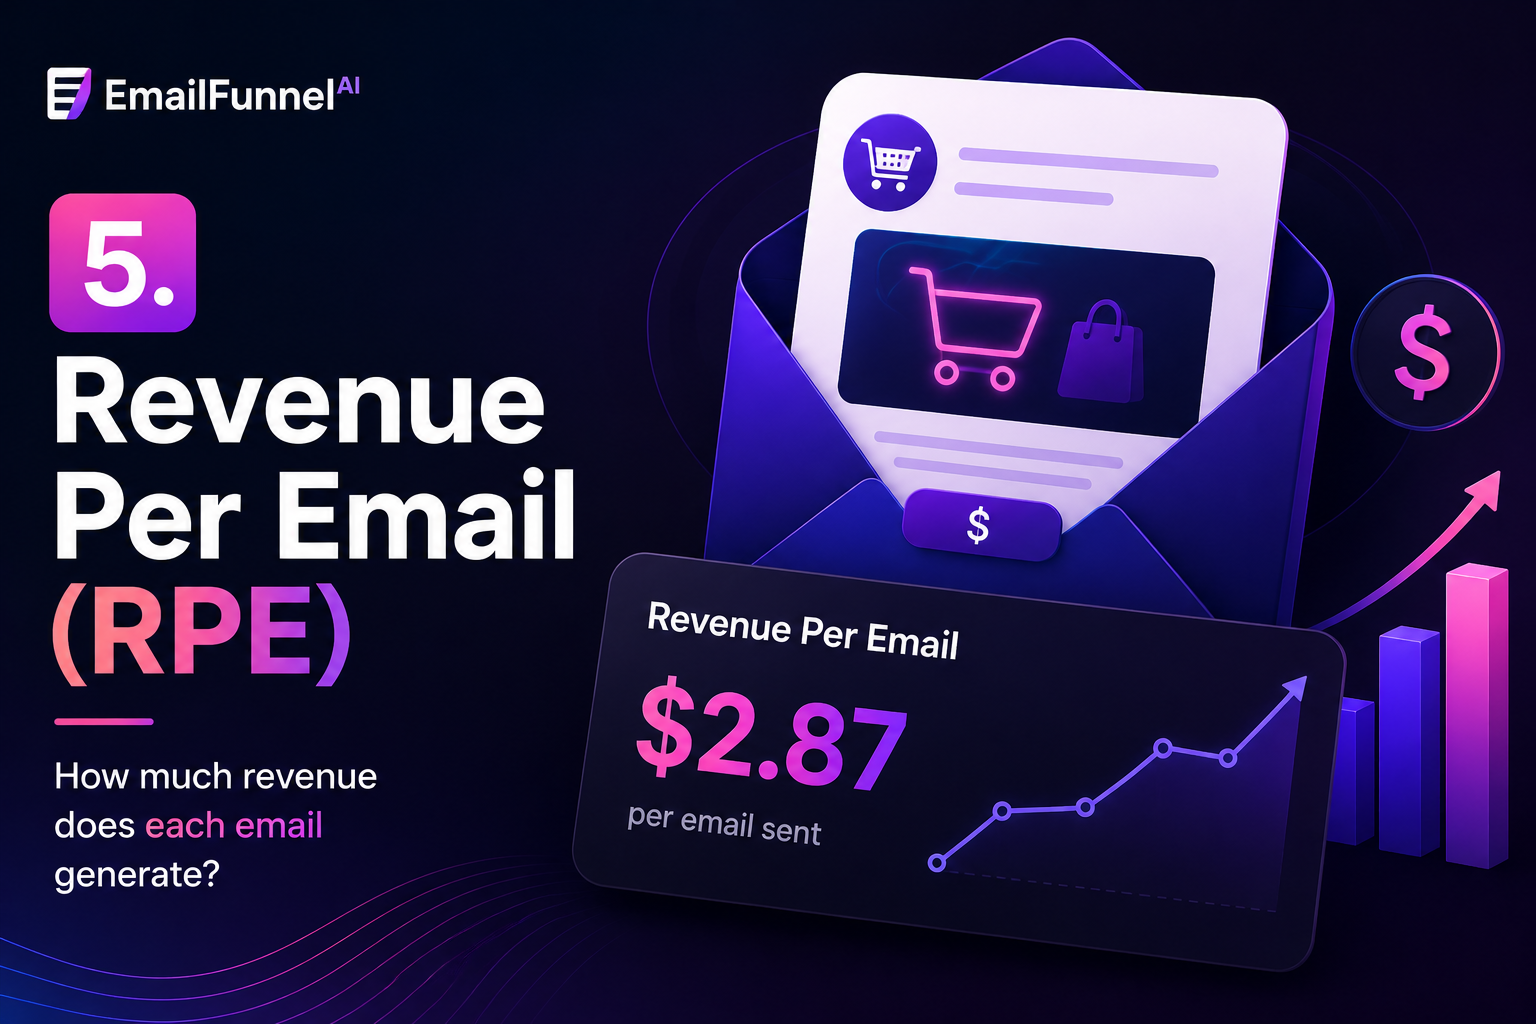
If you’re running ecommerce or sales-driven campaigns, revenue per email tells you exactly how much money each email marketing campaign generates on a per-send basis.
Formula: Total Revenue ÷ Total Emails Sent
Why it matters: RPE lets you compare campaigns apples-to-apples regardless of list size. A smaller, highly targeted list often outperforms a massive, unsegmented one in RPE - a signal that segmentation and targeting matter more than raw volume.
6. Bounce Rate
Bounces come in two flavors: soft bounces (temporary delivery issues) and hard bounces (permanent failures, like invalid addresses). Both matter, but hard bounces are the ones to watch closely.
Formula: (Bounced Emails ÷ Emails Sent) × 100
Why it matters: A high bounce rate damages your sender reputation, which affects the deliverability of every future email marketing campaign - not just the one that caused the bounces. Internet service providers actively monitor this and will start routing your emails to spam if bounce rates stay elevated.
Benchmark: Keep bounce rate under 2%. Anything above that warrants an immediate list cleanup.
7. Unsubscribe Rate
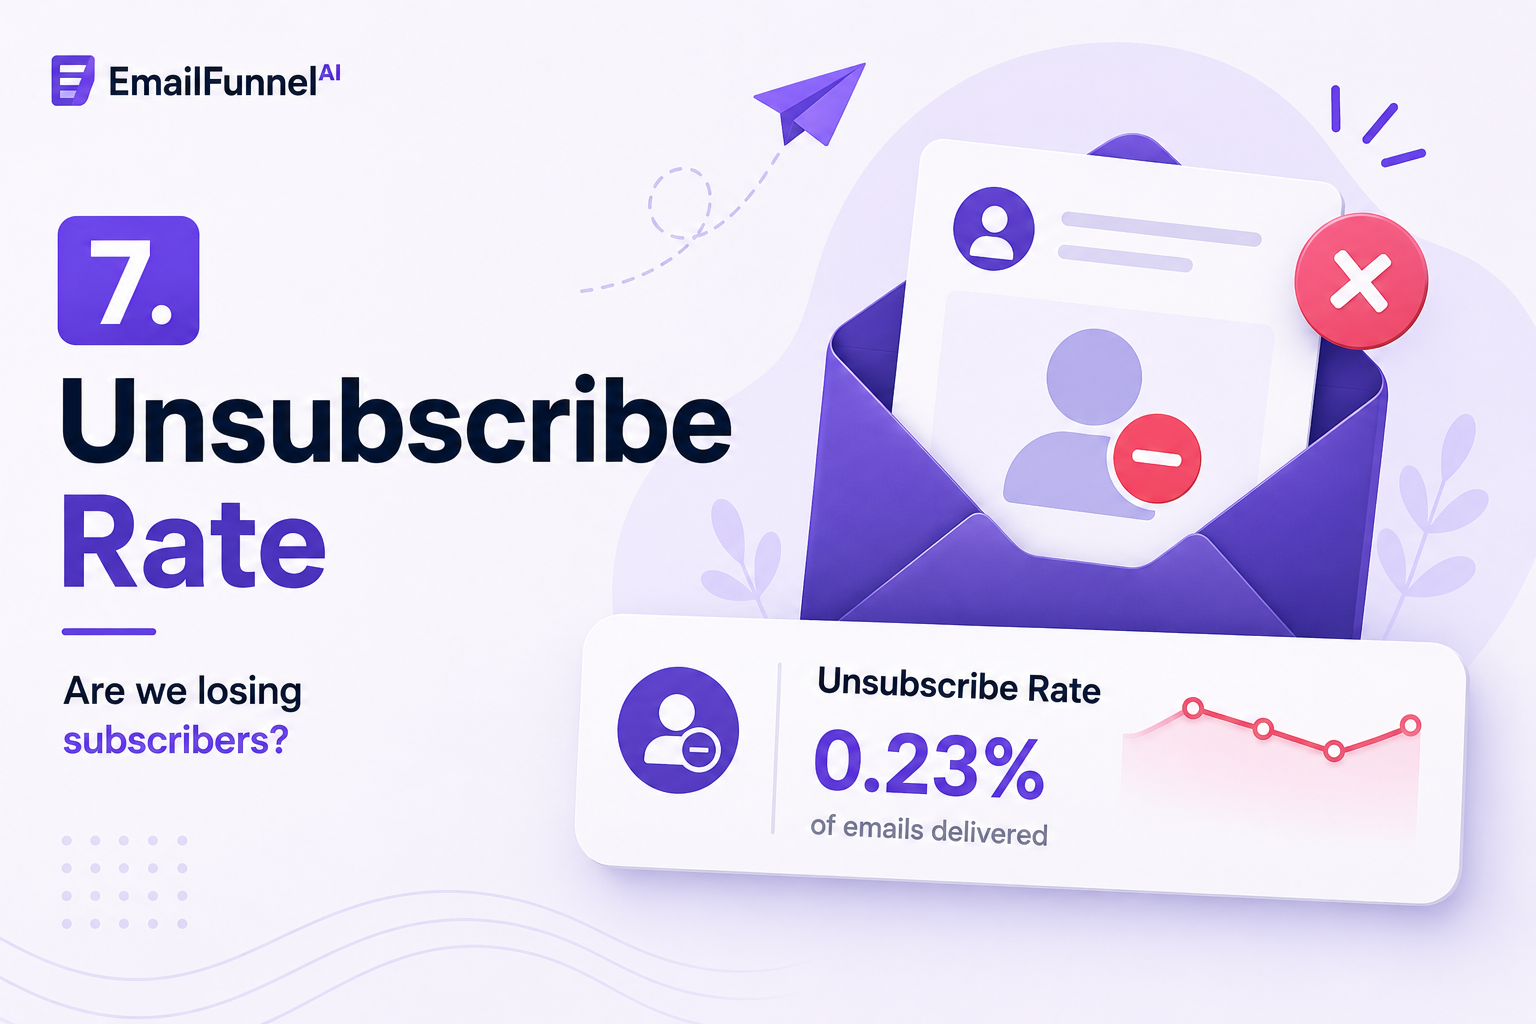
Nobody likes watching subscribers leave, but unsubscribe rate is actually a healthy signal when kept in context. It tells you whether your content, frequency, or targeting is off.
Formula: (Unsubscribes ÷ Emails Delivered) × 100
Why it matters: A small, steady unsubscribe rate is normal and even beneficial - it keeps your list clean and engaged. A sudden spike after a specific email marketing campaign, however, is a red flag worth investigating.
Benchmark: Aim to stay under 0.5% per send.
8. List Growth Rate
Your email list is a living asset - it grows through opt-ins and shrinks through unsubscribes and bounces. Tracking net growth rate tells you whether your list is expanding or quietly eroding.
Formula: ((New Subscribers − Unsubscribes − Bounces) ÷ Total List Size) × 100
Why it matters: Even the best-performing email marketing campaign becomes less effective over time if your list isn’t growing to offset natural attrition (email addresses get abandoned, people change jobs, etc.).
9. Spam Complaint Rate
This is a quieter metric, but it can quietly kill your email marketing campaign performance if ignored. Every time someone clicks “Mark as Spam” instead of unsubscribing, it hurts your sender score.
Formula: (Spam Complaints ÷ Emails Delivered) × 100
Why it matters: Major inbox providers like Gmail and Outlook use spam complaint rate as one of the top signals for deciding whether to deliver your future emails to the inbox or the spam folder.
Benchmark: Stay well under 0.1%. Above that, deliverability problems tend to snowball.
10. Overall ROI
At the end of the day, every email marketing campaign should be judged against the return it generates relative to what it costs to run.
Formula: ((Revenue − Cost) ÷ Cost) × 100
Why it matters: Email consistently ranks among the highest-ROI marketing channels, but that’s only true if you’re tracking it properly. Without ROI tracking, you can’t tell leadership - or yourself - whether your email marketing campaign investment is paying off.
How to Track These Metrics Without Losing Your Mind
Manually pulling these numbers from spreadsheets after every send is a recipe for burnout, and it’s easy to make errors or miss trends that only become visible over multiple campaigns.
This is where a tool like EmailFunnel AI comes in. Instead of digging through raw export data after every email marketing campaign, EmailFunnel AI automatically consolidates open rate, CTR, CTOR, conversion rate, RPE, bounce rate, and unsubscribe trends into a single dashboard. It also uses predictive scoring to flag which subject lines and send times are likely to underperform before you hit send, and highlights which segments are driving the most revenue per email.
For marketers running multiple campaigns a month, that kind of automated, ongoing analysis turns metrics from a monthly chore into a real-time feedback loop - making it easier to spot what’s working and fix what isn’t before it affects your next email marketing campaign.
Ending Notes…
No single metric tells the full story of an email marketing campaign’s success. Open rate without conversion data is just vanity. Conversion rate without deliverability context can be misleading if your list is shrinking due to spam complaints. The real skill is looking at these metrics together, understanding how they influence each other, and using that full picture to refine your next send.
Focus on:
- Engagement metrics (open rate, CTR, CTOR) to gauge interest
- Outcome metrics (conversion rate, revenue per email, ROI) to gauge business impact
- Health metrics (bounce rate, unsubscribe rate, spam complaints, list growth) to protect long-term deliverability
Track all three categories consistently, and your email marketing campaign performance will improve steadily over time - not because you got lucky with one great subject line, but because you’re making informed decisions based on the metrics that actually matter.
People Also Ask
What is a good open rate for an email marketing campaign?
Most industries see healthy open rates between 15–25%, though this varies by sector, list quality, and how “opens” are measured post-Apple Mail Privacy Protection.
What metrics should I track for email marketing campaigns?
The core metrics are open rate, click-through rate, click-to-open rate, conversion rate, revenue per email, bounce rate, unsubscribe rate, list growth rate, spam complaint rate, and overall ROI.
Why is click-through rate more important than open rate?
Click-through rate reflects actual engagement with your content, while open rate can be skewed by automatic image loading and doesn’t guarantee genuine interest.
How often should I review my email marketing campaign metrics? Review key metrics after every send for immediate red flags, and do a deeper trend analysis monthly to spot patterns across multiple campaigns.
What is considered a bad bounce rate?
A bounce rate above 2% typically signals list quality issues and should prompt an immediate list cleanup to protect deliverability.
How can I improve my email marketing campaign ROI?
Focus on list segmentation, personalized content, optimal send times, and continuous A/B testing - and use analytics tools like EmailFunnel AI to identify underperforming elements before they affect results.